Polystyrene Production
-
An example of near real-time in situ measurements of monomer concentration during a polymerization process consists of monitoring the conversion of styrene as it is polymerized to polystyrene via a mini-emulsion process. The ˇ®fraction of styrene convertedˇŻ was calculated from concentration measurements via
Styrene converted = 1- ( Styrene concentration / Initial styrene concentration)
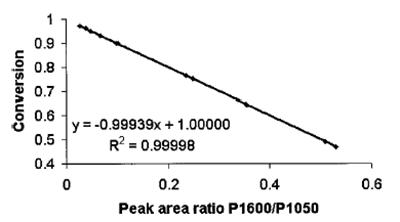
In order to generate a calibration curve to convert the Raman spectroscopic measurements (ratios of peak areas) to styrene concentration prior to the 90 min polymerization run, a monodispersed polystyrene latex was produced with a particle size of 125 nm and a solid content of 28.4%. Samples of the latex were taken and known amounts of styrene were added to each sample and allowed to swell for 48 h. Raman spectra were recorded for each sample of known styrene concentration. The styrene vinyl peak at 1624 cm-1 was used as an indicator of the styrene concentration. The styrene phenyl ring peak at 1000 cm-1 was used as the internal reference and the actual spectroscopic measurement used was the ratio of the area of the styrene vinyl peak at 1624 cm-1 to the area of the reference peak. A scatter plot of the peak area ratios versus the known styrene conversions is plotted in Fig. 1 along with the calibration curve resulting from applying linear regression to the points.
An emulsion having 100¨C200 nm diameters was generated with a ˇ®solid contentˇŻ up to 65%, and placed in a jacket reactor for polymerization at 70ˇăC. The Raman Systems R-2000 instrument with its immersion probe was used to record the Raman spectra every 20 s. The 1/4 in diameter by 5 in long cylindrical stainless-steel probe tip was inserted through and mounted in one of the entry ports to the reactor with the tip protruding into the interior. Six times during the 45 min run, samples of the solution were taken for independent gravimetric analyses, and Raman spectra were recorded on disk for subsequent analyses and comparisons with the gravimetric results. Samples of the Raman spectra recorded are given in Fig. 2.
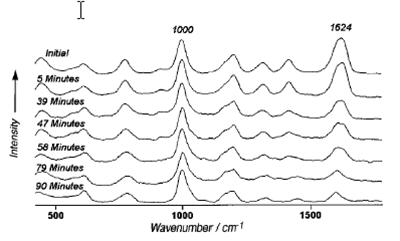
Figure 3 shows a plot of the gravimetric and LRRS spectroscopic (via the calibration curve shown in Fig. 5) measurements of the styrene conversion over the 90 min polymerization run.
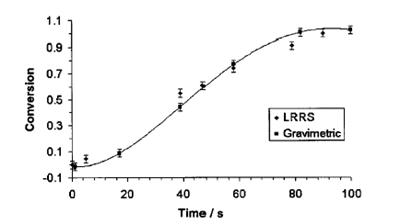
The correlation between the two measurements is excellent, again indicating that affordable LRRS is a viable source of near real-time in situ measurements of monomer concentration during polymerization processes.