Synthetic Rubber Production
-
The chemistry of this copolymerization process involves buta-1,3-diene reacting with styrene in the presence of catalysts and initiators to produce the synthetic rubber polymer GR-S. The monomers were in hexane, which was isolated from air and oxygen by a blanket of nitrogen. Initially the monomer¨Chexane solution was comprised of approximately 5% styrene and 13% butadiene.
The 45 min polymerization run took place in a heated reactor under pressure. The Raman Systems R-2000 instrument with an immersion probe was used to record the Raman spectra every 20 s. The 1/4 in diameter by 5 in long cylindrical stainless-steel probe tip was inserted through a fitting in the wall of the reactor and swage locked into place with the tip protruding into the interior of the reactor. During the 45 min run, samples of the solution were removed from the reactor for independent gravimetric analyses. The spectroscopic measurements were combined with the gravimetric results (every 10 minutes) to produce calibration curves relating the spectroscopic measurements to the concentrations of styrene and butadiene.
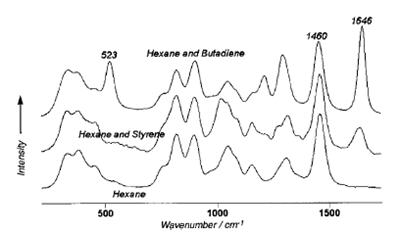
The hexane aliphatic peak at 1460 cm-1 was used as an internal reference and all spectroscopic measurements were made as ratios of process varying peaks to the stationary hexane peak. The butadiene peak at 523 cm-1, which corresponds to the collective motion of conjugated carbons, was used to measure the concentration of butadiene. The vinyl peak at 1646 cm-1, which corresponds to the C C stretching and is common to both monomers, was used to determine the combined concentration of styrene and butadiene present in the mixture. The concentration of styrene was determined by subtracting the concentration of butadiene from the combined concentration of styrene and butadiene.
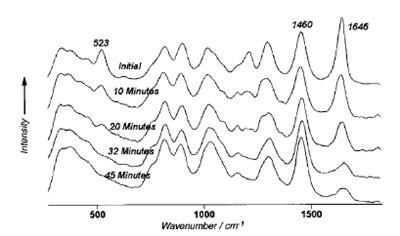
The Raman spectra recorded at the beginning and roughly every 20 seconds into the process are show in Fig. 2. To show visually the results of using the internal reference, the vertical scale for each spectrum was adjusted to hold the peak height of the hexamne peak at 1460 cm-1 (the reference peak) constant across the spectra. An examination of the progression of the butadiene peak at 523 cm-1 indicates that the 13% initial concentration of butadiene had been consumed in 32 min into the process and was no longer measurable from the Raman spectrum. Independent gravimetric analysis yielded a 1.22% concentration of butadiene at that time. A similar examination indicated that the compbined concentration of styrene and butadiene could be determined from the vinyl peak at 1646 cm-1 over the complete process.
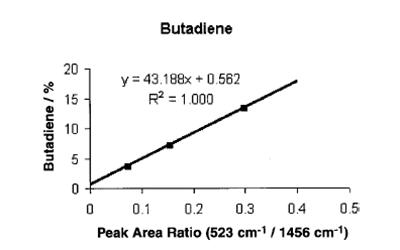
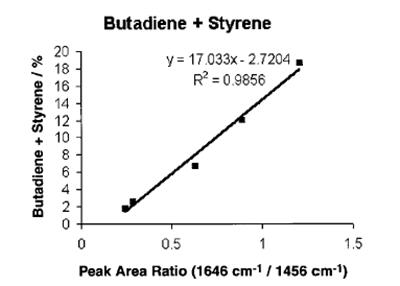
The next two figures are scatter plots of the on-line spectroscopic measurements (peak area ratios measured from the Raman spectra) versus the concentration of butadiene and of the combination of butadiene and styrene measured offline via gravimetric analyses. In the two figures, the y-axis corresponds to the offline measurement and the x-axis corresponds to the spectroscopic measurement. In fig. 3, this is the ratio of the area of the peak at 523 cm-1 (the butadiene peak) to the area of the peak at 1460 cm-1 (the hexane internal reference). In fig. 4, the spectroscopic measurement is the ratio of area of the vinyl peak at 1646 cm-1 to the area of the hexane internal reference peak. The points on the plot correspond to the measurements recorded approximately 10 minutes apart. Calibration curves were generated using linear regression.
The use of these calibration curves with the Raman instrumentation yields an in-situ measurement of the consumption of the monomers every 20s during subsequent polymerization runs.